Kmeans
Data Science project
For this project I was asked to improve the algorithm used to qualify each item of the company on winner, looser or regular. From now AAA, A and B respectively. The company used to qualify each item manually, so each analyst must review item per item, evaluating the sales and rotation of the item in each store, also with the knowledge of each analyst on the colors and the best sellers to the date. That process was very time consuming and inefficient, so the company decided to automate it using a new algorithm.
Firstable I started by analyzing all the data that analysts used to make the decision. I found that the data was not very clean and that there were many missing values, so I had to clean the data and fill in the missing values. When the data was clean I found that the sales of the item weren't enough data to know if it is a good seller in that store or a regular item because of the size of each store—some stores are very big and others are very small—so I decided to use the rotation of the item in each store as a metric to know if the item is a good seller or not. After having all the info organized I started finding out the best models to use. I have different choices such as:
- Logistic Regression
- Random Forest
- Gradient Boosting
- Kmeans
I used a test set to compare the models between each other and also with the current classification of each item to check if it was really wrong or the analyst were doing a sense decitions after that I found that Kmeans was the best model to use.
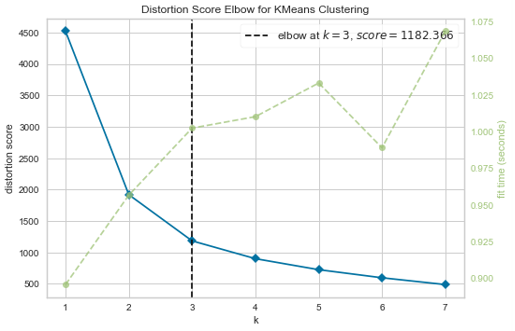
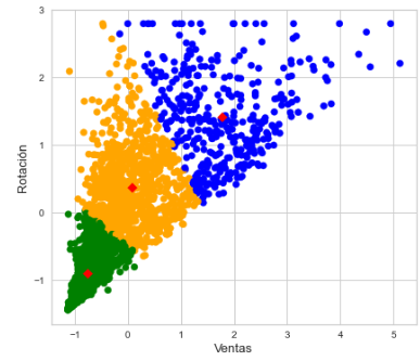
Then I started to implement the model, I used the elbow method to find the best number of clusters so the company was used to classify the items in 5 categories, but the elbow method showed me that the best number of clusters was 3. I had to explain to the company that the best number of clusters was 3 and not 5, so for terms of inventory management and sales strategy, the company had to change the categories of the items.
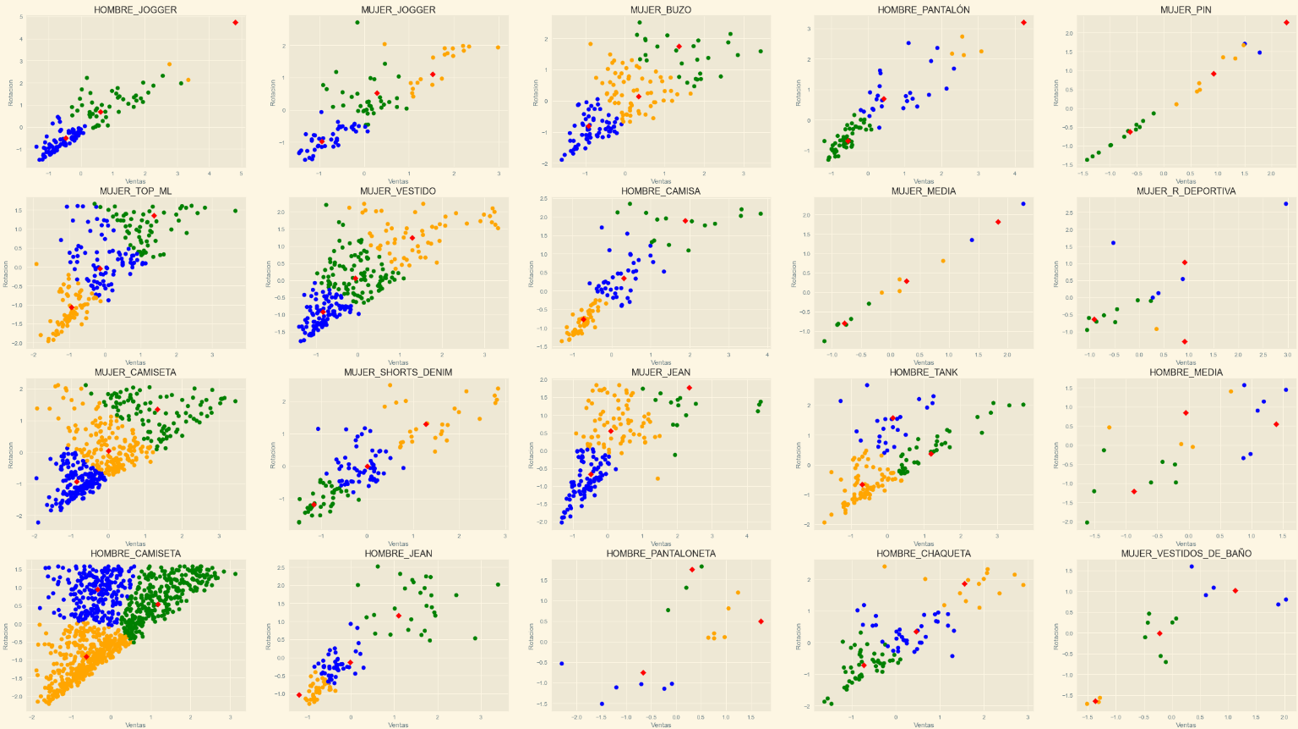
After that I trained the model and I used the test set to check the accuracy of the model, I found that the model had a bad accuracy, so I started to analyze the data and I found that the data must be separated by category because each category has its own average of sales and rotation and also I must filter the Franquises because we didn't have enough data to classify them and it blinded the model.
The new results were very good, the model had an accuracy of 85%, so the company decided to use the model to classify the items. The company also asked me to create a dashboard to show the results of the model, so I used Power BI to create the dashboard.