distribution of surpluses
Data Science Project
For this project I was asked to improve the distribution of those items that the company had a lot of them but each unit in different stores so the main objective is to group them in the minimum number of stores possible but also taking into account the number of units sold in each store. This process used to be done manually and divided between 4 analysts, so each analyst must review item per item, evaluating the sales and rotation of the item in each store to choose the best store to send the surplus. This process was very time consuming and inefficient, so the company decided to automate it.
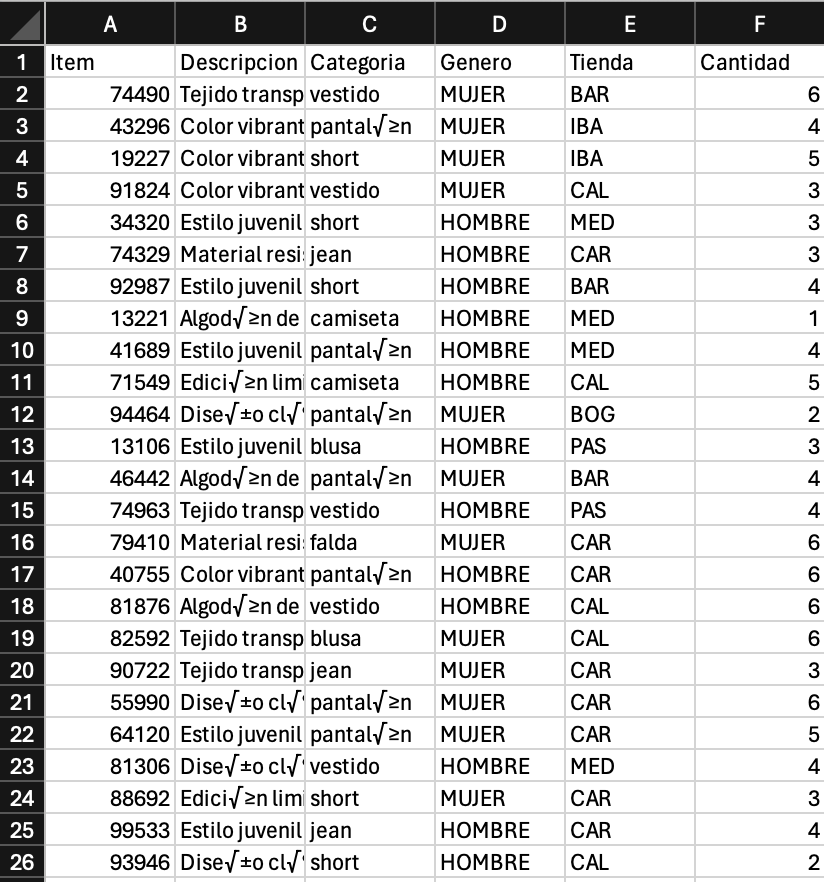
The first step was to analyze the data and understand the problem, so I started by analyzing all the data that analysts used to make the decision. I found that the data was not very clean and that there were many missing values, so I had to clean the data and fill in the missing values. When the data was clean I found that the sales of the item weren't enough data to know if it is a good seller in that store or a regular item because of the size of each store—some stores are very big and others are very small—so I decided to use the rotation of the item in each store as a metric to know if the item is a good seller or not. To calculate the rotation of the item in each store, I used the following formula:
$$ \text{Rotation}_{\text{store}} = \frac{\text{Units Sold}_{\text{store}}}{\text{Units in Stock}_{\text{store}}} $$
Once I had the rotation of the item in each store, I pondered the rotation of the item in each store with the number of units in stock to get a metric that tells me if the store is a good place to send the surplus or not. To calculate this metric, I used the following formula:
$$ \text{Metric}_{\text{store}} = \text{Rotation}_{\text{store}} \times \text{Units in Stock}_{\text{store}} $$
With this metric, I was able to know which store was the best place to send the surplus, so I grouped the items by the store that had the highest metric. This process was very efficient and reduced the time that analysts spent on this task by 80%. I also added some filters to follow the business rules, for example, if the store is in a different city, the item can't be sent to that store. Or that Franquise stores can't receive items from other stores.
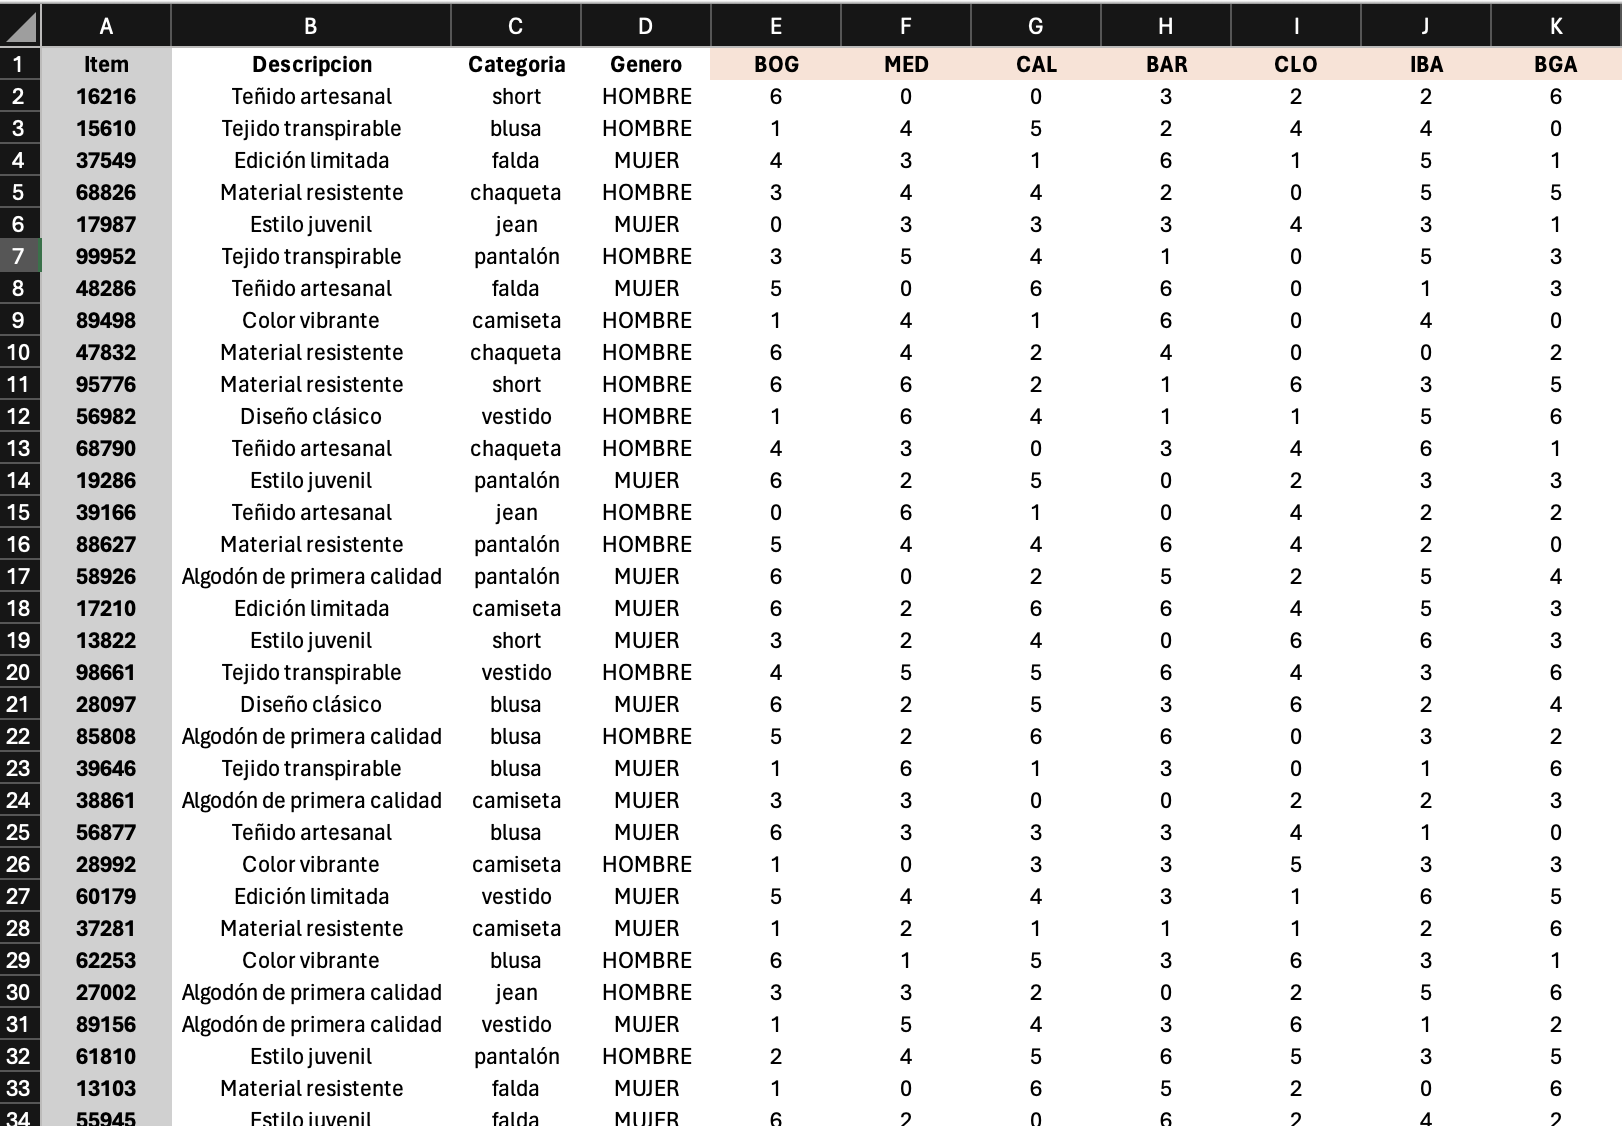
Finally the company needed the data as a matrix to be easier to separate the items by store, so I created a matrix with the items per size in the rows and the stores in the columns, and the value of each cell is the number of units of that item in that store. This matrix was very useful for the logistics team to separate the items by store and send them to the correct store.
This project was very interesting because I had to analyze the data and understand the problem to find the best solution. I also had to work with the logistics team to understand how they work and what they need to make their job easier. I learned a lot about the business and how to improve the processes to make the company more efficient.